convertRDI - Convert RDI measures
Description
Method to convert RDI values to fold/percent change
Usage
convertRDI(d, models = NULL, calcSD = FALSE)
Arguments
- d
- Distance matrix (as produced by calcRDI), or a vector of distances.
- models
- Set of RDI models, as produced by rdiModel. If
NULL, RDI models will be calculated based on the attributes in the distance matrix. - calcSD
- logical; if
TRUE, standard deviations for each estimate will be returned.
Value
A list containing either one or two features:
| *pred* |
| The converted predictions; same length as `d`. |
Details
The convertRDI function works by first generating a model for the RDI values at a given repertoire size and feature count using the rdiModel function (see that method’s help file for more details). The RDI models predict the average log-fold/percent change across a range of RDI values, and allows us to convert RDI to a more stable and interpretable metric.
In addition to the average log-fold or percent change value, rdiModel also generates models for the standard deviation at each RDI value. This is useful for understanding the confidence intervals around the fold change estimate.
Examples
#create genes
genes = sample(letters, 10000, replace=TRUE)
#create sequence annotations
seqAnnot = data.frame(donor = sample(1:4, 10000, replace=TRUE))
#calculate RDI
d = rdi(genes, seqAnnot)
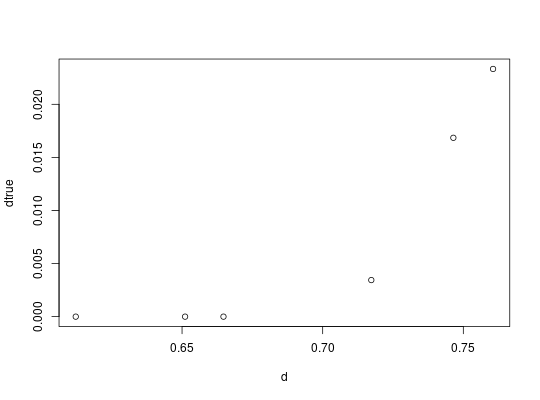
##convert RDI to actual 'lfc' estimates and compare
dtrue = convertRDI(d)$pred
plot(d, dtrue)
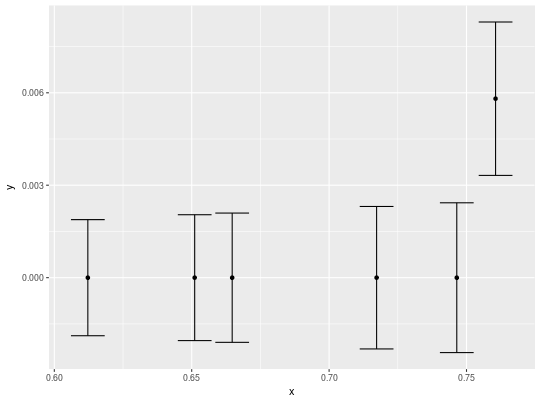
##look at SD ranges around lfc estimates
dtrue = convertRDI(d, calcSD=TRUE)

##plot using ggplot2
library(ggplot2)
x = as.numeric(d)
y = as.numeric(dtrue$pred)
sd = as.numeric(dtrue$sd)
qplot(x,y)+geom_errorbar(aes(x=x, ymin=y-sd, ymax=y+sd))