rdi - Calculate RDI dissimilarity matrix
Description
Wrapper function for calculating RDIs
Usage
rdi(genes, seqAnnot, params = NULL, ...)
Arguments
- genes
- vector (or matrix) containing the gene calls for each sequence. If genes is a matrix, counts will be calculated for each column of ‘genes’, and the resulting count matrices will be concatenated.
- seqAnnot
- matrix containing repertoire annotations. Must be same length as ‘genes’.
- params
- list; contains parameters to pass to child functions.
Should contain
countParamsanddistParamslists, which contain parameters for calcVDJcounts and calcRDI, respectively. See Details. - …
- other parameters to pass to calcVDJcounts and calcRDI.
Value
Dissimilarity structure, as calculated by dist. In addition to the standard attributes returned by dist, two additional attributes are defined as follows:
| nseq |
| integer, the number of sequences used after subsampling the repertoires |
Details
This function is a wrapper for the two core functions of RDI,
calcVDJcounts and calcRDI. To control the function of
both calcVDJcounts and calcRDI, additional parameters can be specified
either directly in the RDI function call, or parameters for the individual functions
can be wrapped up into lists of parameters and passed into the params parameter.
params should be a list containing at least one of two parameter lists:
countParams and distParams, which
will be passed to calcVDJcounts and calcRDI, respectively. An example
analysis is included below.
Examples
#create genes
genes = sample(letters, 10000, replace=TRUE)
#create sequence annotations
seqAnnot = data.frame(donor = sample(1:4, 10000, replace=TRUE),
visit = sample(c("V1","V2","V3"), 10000, replace=TRUE),
cellType = sample(c("B","T"), 10000, replace=TRUE)
)
#parameters
params = list(
countParams = list(
select = list(
visit = c("V1","V3"),
cellType = "B"
),
combine = list(
visit = "V[13]"
),
simplifyNames = FALSE
),
distParams = list(
constScale=FALSE
)
)
##calculate RDI
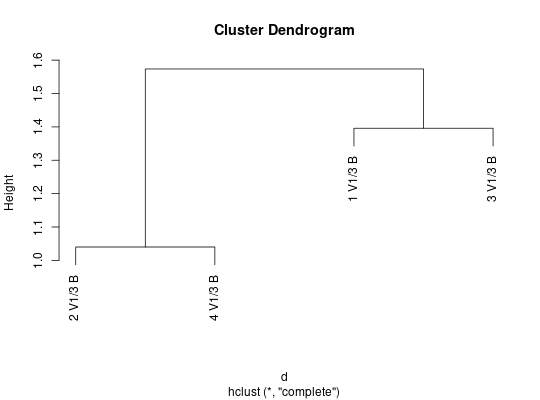
d = rdi(genes, seqAnnot, params)
##plot using hierarchical clustering
plot(hclust(d))